Here we are going to break down a UCI rider’s calendar. He is a very strong rider who likes hard races (long races with plenty of repeated efforts).
Explore:
- Which of the races is the hardest in order to target when we want him to be a peak form.
- How a hard race is made up so we can develop a few sessions to replicate the demands.
Our data source is 2-3 years of every race on his 2023 racing calendar. 40-100 rides per race binned into the top 10.
Average Race
Total kj: 4019 kj
kj above normalised: 2640 kj
Av power: 243 w
No. Bursts: 197

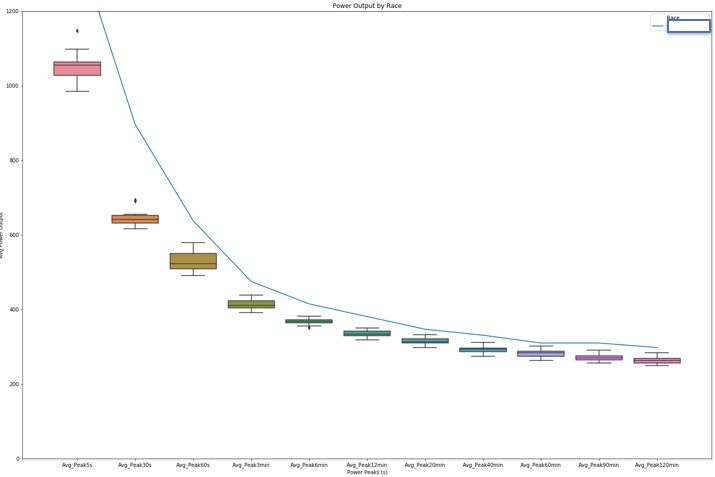
Apologies as you might have to zoom in a bit on this one. Above is the average power curve of every race on the calendar. Each point along the power curve is a box plot of all the races average power values for that point on the curve. The min and max power and race is labeled.
For example the third point on the curve is average peak 60s power. Overjise is the highest with 579w, Overjissel is the lowest with 490w.
I’m not going to lie, I’m pretty pleased with myself for this.

Now let’s take our riders power curve (post 3000kj) and overlay it.

His power (the blue curve) is well above the average and maximum average values. This is a great sign that he has the ability to get better than average results in any of these races.
Hardest Race
RACE: Le Samyne 1.1
kj above normalised: 3121 kj
Av power: 278 w
No. Bursts: 222

RACE: Overijssel 1.2
kj above normalised: 3191 kj
Av power: 278 w
No. Bursts: 220

RACE: GPJefScherens 1.1
kj above normalised: 2721 kj
Av power: 240 w
No. Bursts: 266

RACE: Egmont 1.1
kj above normalised: 2776 kj
Av power: 236 w
No. Bursts: 325
- A burst is an effort longer than 3s over 3min max.
- Threshold wasn’t present in the dataset so NP is substituted.
Here ‘hard’ is defined as energy spent over normalised power and number of bursts.
Egmont had the most bursts. Its a very grippy circuit with cobbles and a little climbs (~3% for 1km). Normally finishes in a bunch sprint.
Overijssel had the most kj above NP. But it seems slightly skewed from how hard the 2019 edition was.
Le Samyne is only just behind in kj above NP and has more than average number of bursts. On the previous slide you can see the race with the most max values along the average power curve is Le Samyne. Therefore thats the ‘hardest’ race.
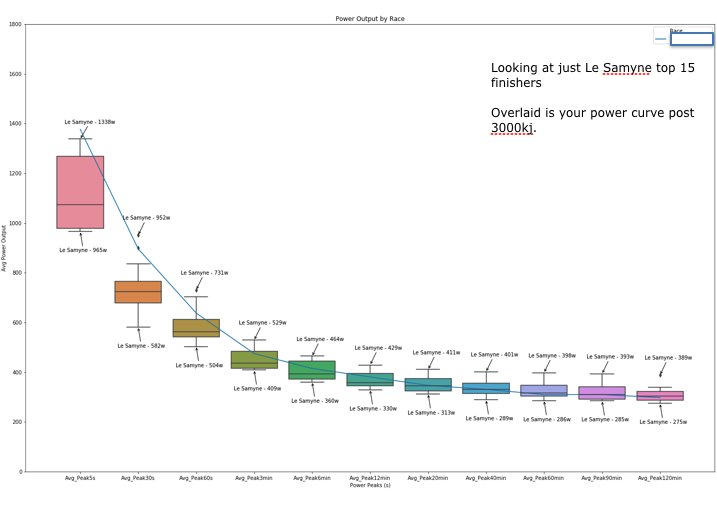
Now lets look at our riders power curve (post 3000kj) vs the total (not average) power values at Le Samyne.

Hopefully you can read the chart.
So now the data is only riders who finished in the Top 15. Each box is topped and tailed with the max and min power values.
Yes someone did 390w for 2h (and came 3rd). https://www.strava.com/activities/315102233
Our riders power curve is still better than average, but beyond 3mins now falls inside the box for each point along the curve. This suggests he can get top 15 results at this race. And in my opinion his best chance of a big result will come sprinting from a small group as thats where his power curve is still strongest (5 – 30s) compared to those raced in the past.
What can we put into practice?
Thats what people pay me for!

