
In my last post I introduced my training framework. Here I will give specific examples of how I am using it. Recently I undertook the INSCYD Critical Power test to give the most accurate picture of my current ability. The more insightful the data the more accurate the training program can be.
In order to write a great training plan, you need to know what you want. I have some ambitious goals for 2020.
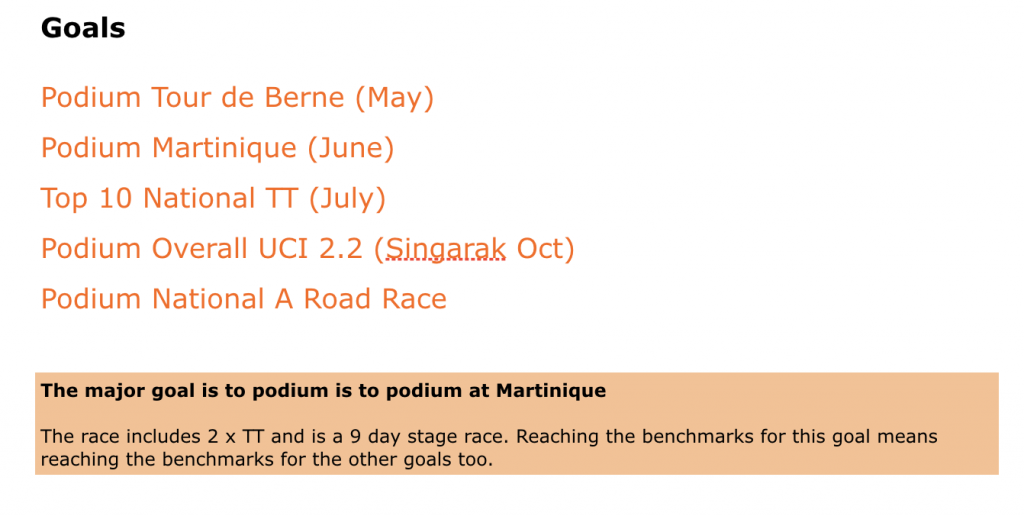
I have a pretty good idea of what it will take to achieve them, breaking the goals down in a previous planning post and highlighting some key performance benchmarks.
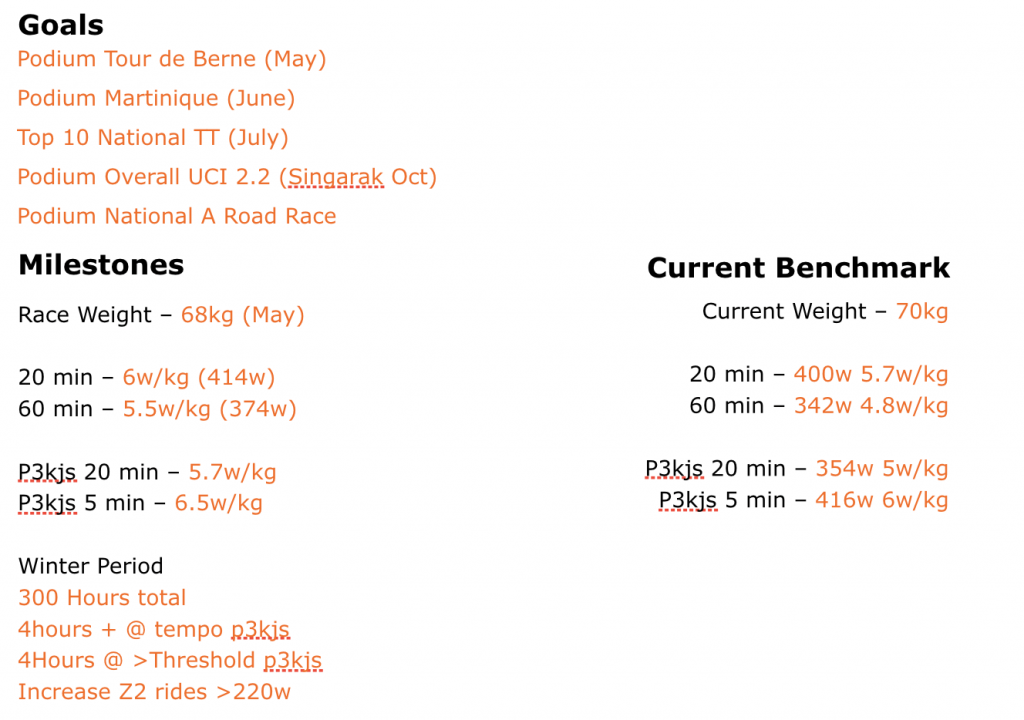
To add some Environmental and Race Specific factors into those milestones.
- Both Martinique and Singarak will be extremely hot and humid, (30-35C and 90/95% Humidity). Acclimatising to the heat will be essential. It doesn’t take too long (~2 weeks) for your body to adapt so I will cover this at a later date.
- Both are 9 day races, with tough mountain stages.
- Martinique has two key time trials, so it’ll be important to train and develop my power output in that more extreme position. I have always struggled to produce similar power on the flat compared to a climb where I can get out the saddle.
Testing with INSCYD
After a few simple tests we can work out:
- Body composition
- Threshold and training zones
- Vo2 Max
- Metabolic combustion rate (fat/carb)
Previously to get the same level of insights I had to go to the local university lab and undergo a ramp test. With INSCYD I did all the testing on the road on my own bike with my own power meter. Straight away I know this data is more useful than from the lab as the environment in which I conduct the testing is the same as I race and train.
The testing all had to be done seated, to pinpoint exactly what’s going on in the working muscles (your legs!). The protocol was as follows:
- 20s sprint
- 4min overpowered effort (you go out as hard as possible and hang on for dear life, I can confirm it’s as horrible as it sounds)
- 2.5min Max effort
- 12min Max effort
- 6min Max effort
Results
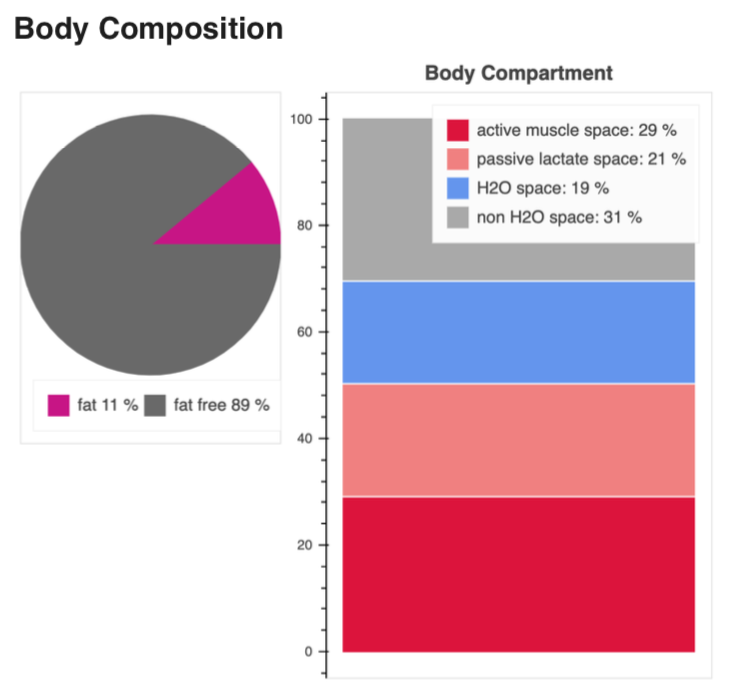
The graphs and the table above show your actual body composition. Please pay close attention to the body fat, and fat free values.
I think the scales are telling lies, 11% body fat at 69kg/188cm seems high. However since October I haven’t exactly been eating.. cleverly. Think bread, bread and more bread. Ideally I want to reduce this down to around 9% fairly quickly and further reduce it for the key race dates in July and October. I want to see the active muscle space increase, more active muscle space = more glycogen storage = more hard work potential. 1KG of highly trained muscle can hold approximately 25g of glycogen. (69.5 x 0.29) x 25 = ~500g of glycogen potentially stored and available when racing/training on the bike.

VO2 max is the maximal oxygen consumption during exercise, your aerobic capacity. Basically, how much air can you fit in your lungs, how much blood can be pumped around the body (heart rate x stroke volume) to transport oxygen to the working muscles and carbon dioxide back to the lungs. How much oxygen can the blood carry and importantly, the efficiency of the muscles to use the oxygen as fuel.
For any endurance athlete your aerobic capacity is incredibly important. It is the intensity ceiling at which you can produce energy (ATP) via cellular respiration. Very simply the higher your VO2 max, the harder and further you will be able to go.
My V02 max of 72.8ml/min/kg isn’t bad, this time last year I did a lab test and achieved only 67ml/min/kg (I was 2kg heavier). A score of 67 or above is generally considered the ‘entry ticket’ to elite performance. It doesn’t mean you are or will be, but you have the potential to be.
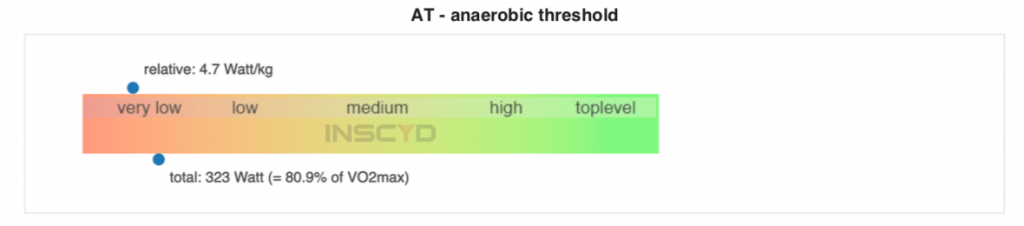
The Anaerobic Threshold is the maximum intensity at which lactate production = lactate clearance. Going beyond this causes lactate accumulation in the working muscles, experienced as that burning fatigue in your legs (the blood becomes too acidic as the lactate cannot be oxidised fast enough). This threshold is determined by your VO2max, as lactate clearance is determined by cellar respiration. VO2 max is the ceiling for this threshold, but you can train to be as close to the ceiling as possible. Currently mine is at 81% of V02 max, during periods of last season WKO4 modelled it as high as 86% of 77ml/min/kg (378w). Also showing how trainable VO2 max is. For reference WKO4 is currently modelling my VO2 max at 72.8ml/min/kg.


VLamax is the maximum lactate production rate or maximal glycolic power (anaerobic capacity). If this is high, then you’ll have good explosive power. But you’ll also be using a higher % of this system than if it was a lower score. Meaning your burning more carbs and producing more lactate. Reducing VLamax allows for a higher anaerobic threshold, higher fat combustion and better carbohydrate sparing.
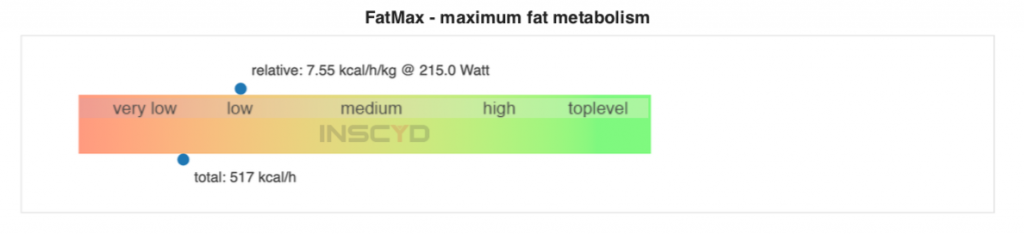
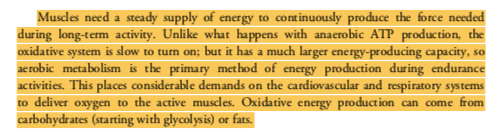
FatMax is the maximum rate at which fats can be oxidised and used for cellular respiration. The longer the event, the more important this becomes. You have far more fat stored in your body than carbohydrate, using fats as a fuel source saves this limited carbohydrate for more intense efforts where fats cannot be oxidised quickly enough.
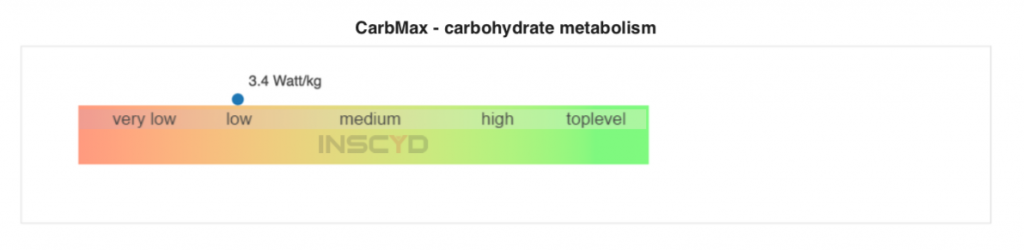
CarbMax is the intensity at which you are combusting carbohydrate at 90g/hour. This being the maximal absorption rate. So at this intensity you would have the same amount of carbohydrate or stored muscle glycogen at the end of a ride as the beginning, when consuming 90g/hour.
These energy systems do not work completely independently from each other. INSCYD shows this relationship at any given intensity. This means that we can prescribe more accurate training, ensuring you are working at the right intensities and resting for the right durations = the right training adaptations. In racing we can accurately set pacing and nutrition strategies to ensure you perform to your maximum potential on the day.
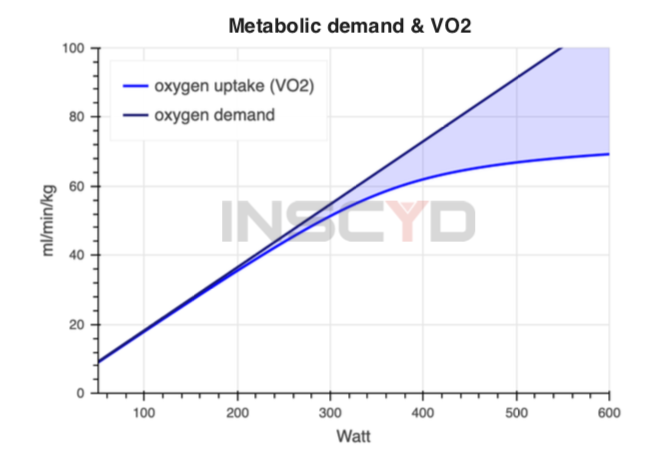
At lower intensities, the actual oxygen uptake almost matches the oxygen demand, thus the needed amount of energy is almost completely covered by aerobic metabolism. At higher intensities however, a gap is opening up and the oxygen uptake cannot match the demand. This gap is shown as the light blue area, and shows the amount of energy (or more precisely oxygen) which needs to be covered by glycolytic metabolism. In short, the higher you can train your VO2 max the less you rely on the fast fatiguing glycolytic metabolism.
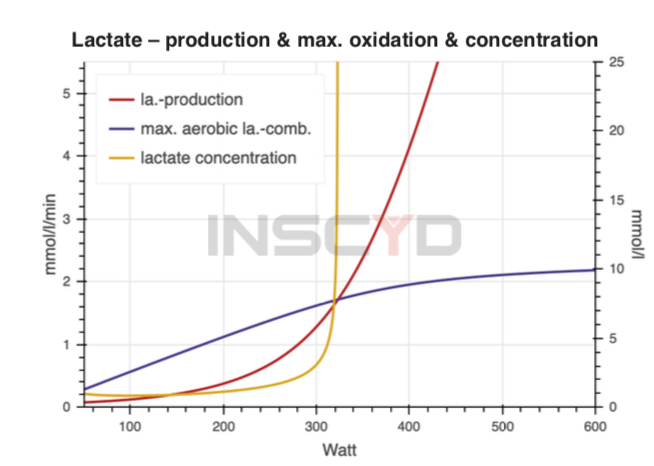
During exercise lactate is be cleared from the muscle cell by aerobic metabolism (oxidation). Simplified, lactate gets burned and acts as a fuel in the aerobic metabolism. Therefore, the rate at which lactate can be cleared is directly related to the actual oxygen uptake. Notice the shape of the blue lactate clearance curve looks similar to the oxygen uptake curve above. The crossing point of the lactate production (red) and the lactate combustion (blue) is intensity of anaerobic threshold.
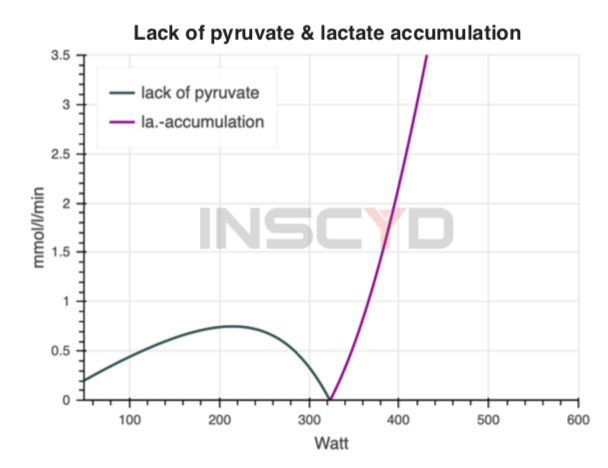
The top right graph shows the lack of pyruvate (or lactate, grey line) and the actual lactate accumulation (purple). It shows the ability to recover from lactate accumulation in relation to the intensity (speed or power). At anaerobic threshold it runs to zero – the aerobic metabolism is saturated with lactate and no additional lactate can be combusted. The purple curve shows the rate of lactate accumulation. This occurs at intensities higher than anaerobic threshold. The steeper the curve, faster lactate accumulation at any given intensity. At 220w my lactate combustion is at Max. Very useful for developing interval sessions.
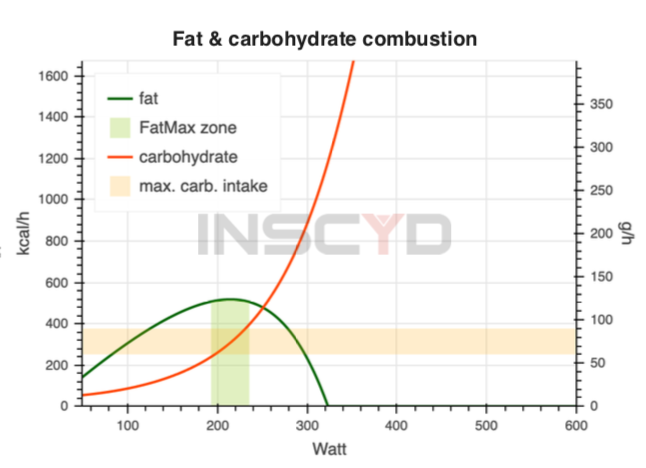
The bottom right graph shows the fat combustion (green curve) in kcal/h on the left y-axis. The red curve shows the carbohydrate combustion in kcal/h (left yaxis) as well as in grams per hour (right y-axis). The green area marks the maximum fat combustion 200-240w (FatMax) +/- 5%. The orange area marks a carbohydrate combustion rate of 60-90g/h . According to the latest scientific findings, this is the maximum exogenous carbohydrate combustion rate – independent of the amount of oral intake of carbohydrates. The CarbMax value is based on this curve: CarbMax marks the power (Watt/kg) or speed (m/s) at which carbohydrate combustion exceeds 90g/h 240w.
What do the results mean?
There are a few standout results that have an immediate impact on my performance benchmarks highlighted earlier.
Increase my FatMax. This is going to have a positive effect on my VO2 max by building it up from below, spending prolonged periods of time at around 220w. Doing these rides in a fasted or low carb state I am ensuring fat combustion over carb combustion, while also having a positive effect on my diet and overall body composition. Increasing FatMax will also play a big role in fatigue resistance. The more you can utilise fat, the more carbohydrate is available for the big race winning efforts.
Decrease my VLamax, Increase Anaerobic Threshold. Currently if I was doing a 20min 6w/kg effort around 25% of the energy would be produced via the glycolic system burning a huge amount of carbohydrate, so much it’s off the scale on the Fat/Carb combustion chart.. Lactate would be accumulating at around 3mmol/min. So for 20mins that’s 60mmol, impossible.
How does it affect my training?
The testing also highlighted the big gap between my seated power and my max power generated alternating between seated and standing. In the last 6 weeks I have produced 450w for 5mins but during the 6min seated test I struggled to hold 390w. By training and doing my efforts seated based on the power number above I can increase my power in the saddle (also helping my time trialling) and save those really big combined efforts for when they really matter!
I need to spend more time in the FatMax zone with reduced glycogen availability. I can do this by riding fasted, or semi fasted after a low carb breakfast. Or I can burn through my glycogen stores with some hard efforts early in the ride. Using my results I know exactly how long and how hard to go.
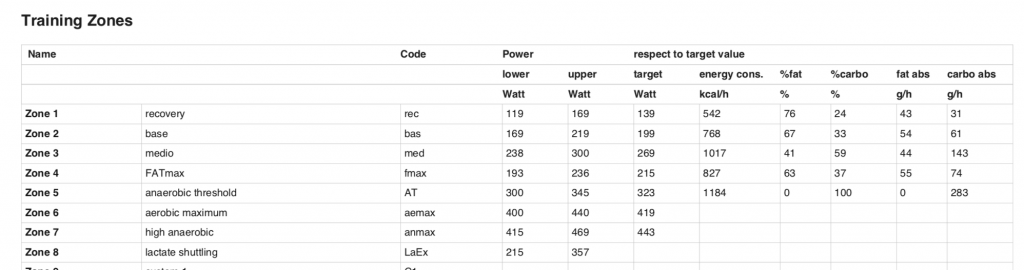
In order to reduce my VLamax, I need to target my slow twitch (type 1) muscle fibres and develop better oxidative capacity of my fast twitch (type 2a) muscle fibers . I know that by keeping my power below 280-320w I am going to be getting the right adaptations, as this is the upper end of my aerobic capacity without recruiting the glycolytic system too much.
For maximal VO2 max adaptations I can develop a session such as:
3-5x (90s @ 443-469w (High anaerobic) immediately followed by 5-8mins of 30s @ 400w (max aerobic) 15s @ 215w (max lactate clearance))
I have a really clear picture of my goals, what it will take to achieve them and my current ability. Now I can plan the progression from current ability to benchmark ability.